There is an increasing use of the water infrastructure, while the current demand is already adjacent to the existing capacity. However, space for physical expansion is limited. On the other hand, there is a tightening of budgets, while maintenance of water infrastructure comes with high costs.
Huge cost savings as well as reducing public inconvenience can be achieved with a preventative maintenance program. Benefits of a preventive maintenance program are:
A longer lifetime for your equipment with preventive maintenance
Be in control and optimize your processes
Optimize your just-in-time management and get more value by delivering guarantees
Increase security for your cargo and your equipment
Struggle with the elements
Working at water is a struggle with the elements: water, wind, dust, heat, pressure. So, you want to know if pipelines are going to leak before they are actually leaking. When cables are beginning to wear out. If the oil is still on the right level. That you can act when dust or smear are blocking lenses. With IoT, you can predict and prevent equipment failure by monitoring product wear and replacement rates. As such, you improve the reliability of your assets and reduce downtime. And if you recognize little faults, you can solve them easily before they have become big and expensive problems.
Rust
Another time- and money saver is the maintenance in the port: one of the worst enemies is rust. No wonder, that the in- and outside of the ship is painted very often. Even when there is no rust, ‘just in case’. It is better to place a rust sensor: it warns when there is rust and those places can be painted or otherwise maintained. And it makes sure spots are not forgotten. Even more: a rust sensor can track rust at places which are hardly reachable. An employee only has to go to this hard-to-reach part when it is really needed.
How preventive maintenance works
In essence, algorithms and analytics monitor sensor data. They look for deviations in a physical process’s normal operation. Examples are the wear and tear in a water sluice’s mechanical components, or even damaged wiring for the pump.
A sensor fusion algorithm merges data from different sensors. Associated analytics determine whether a component’s characteristic is normal for its age. Any deviations outside ‘normal operation’ are fed back to the master system as potential sources of failure.
https://www.advsolned.com/wp-content/uploads/2018/08/shutterstock_134100869oil_chains_1130.jpg7511130ASN consultancy teamhttps://www.advsolned.com/wp-content/uploads/2021/07/asn_logo_red_met_tekst_helder-e1755353934770.pngASN consultancy team2019-12-04 09:23:212020-04-23 10:50:28Smart Water: Less delay due to timely maintenance
Modern embedded processors, software frameworks and design tooling now allow engineers to apply advanced measurement concepts to smart factories as part of the I4.0 revolution.
In recent years, PM (predictive maintenance) of machines has received great attention, as factories look to maximise their production efficiency while at the same time retaining the invaluable skills of experienced foremen and production workers.
Traditionally, a foreman would walk around the shop floor and listen to the sounds a machine would make to get an idea of impending failure. With the advent of I4.0 AIoT technology, microphones, edge DSP algorithms and ML may now be employed in order to ‘listen’ to the sounds a machine makes and then make a classification and prediction.
One of the major challenges is how to make a computer hear like a human. In this article we will discuss how sound weighting curves can make a computer hear like a human, and how they can be deployed to an Arm Cortex-M microcontroller for use in an AIoT application.
Physics of the human ear
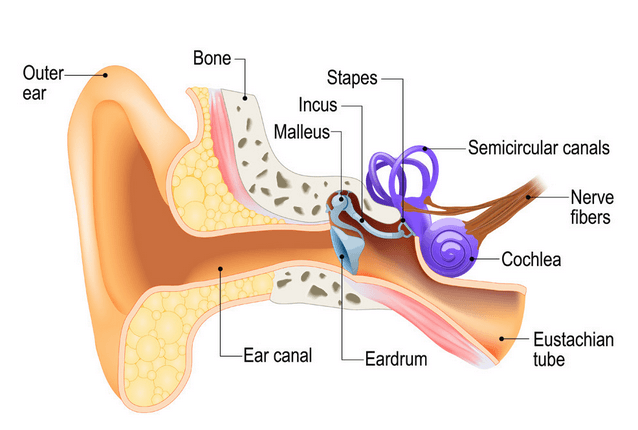
An illustration of the human ear shown below. As seen, the basic task of the ear is to translate sound (air vibration) into electrical nerve impulses for the brain to interpret.
The ear achieves this via three bones (Stapes, Incus and Malleus) that act as a mechanical amplifier for vibrations received at the eardrum. These amplified sounds are then passed onto the Cochlea via the Oval window (not shown).
The Cochlea (shown in purple) is filled with a fluid that moves in response to the vibrations from the oval window. As the fluid moves, thousands of nerve endings are set into motion. These nerve endings transform sound vibrations into electrical impulses that travel along the auditory nerve fibres to the brain for analysis.
Modelling perceived sound
Due to complexity of the fluidic mechanical construction of the human auditory system, low and high frequencies are typically not discernible. Researchers over the years have found that humans are most perceptive to sounds in the 1-6kHz range, although this range varies according to the subject’s physical health.
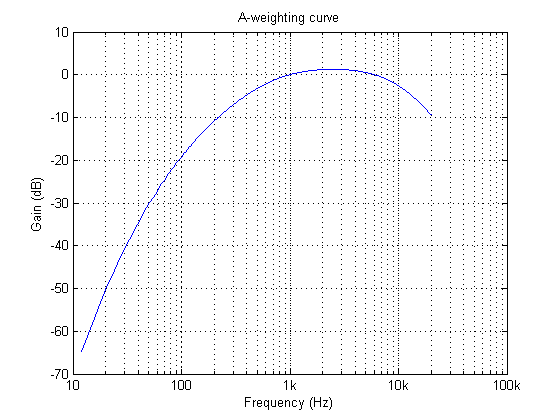
This research led to the definition of a set of weighting curves: the so-called A, B, C and D weighting curves, which equalises a microphone’s frequency response. These weighting curves aim to bring the digital and physical worlds closer together by allowing a computerised microphone-based system to hear like a human.
The A-weighing curve is the most widely used as it is mandated by IEC-61672 to be fitted to all sound level meters. The B and D curves are hardly ever used, but C-weighting may be used for testing the impact of noise in telecoms systems.
The frequency response of the A-weighting curve is shown above, where it can be seen that sounds entering our ears are de-emphasised below 500Hz and are most perceptible between 0.5-6kHz. Notice that the curve is unspecified above 20kHz, as this exceeds the human hearing range.
ASN FilterScript
ASN’s FilterScript symbolic math scripting language offers designers the ability to take an analog filter transfer function and transform it to its digital equivalent with just a few lines of code.
The analog transfer functions of the A and C-weighting curves are given below:
\(H_A(s) \approx \displaystyle{7.39705×10^9 \cdot s^4 \over (s + 129.4)^2\quad(s + 676.7)\quad (s + 4636)\quad (s + 76655)^2}\)
\(H_C(s) \approx \displaystyle{5.91797×10^9 \cdot s^2\over(s + 129.4)^2\quad (s + 76655)^2}\)
These analog transfer functions may be transformed into their digital equivalents via the bilinear() function. However, notice that \(H_A(s) \) requires a significant amount of algebracic manipulation in order to extract the denominator cofficients in powers of \(s\).
Convolution
A simple trick to perform polynomial multiplication is to use linear convolution, which is the same algebraic operation as multiplying two polynomials together. This may be easily performed via FilterScript’s conv() function, as follows:
y=conv(a,b);
As a simple example, the multiplication of \((s^2+2s+10)\) with \((s+5)\), would be defined as the following three lines of FilterScript code:
a={1,2,10};
b={1,5};
y=conv(a,b);
which yields, 1 7 20 50 or \((s^3+7s^2+20s+50)\)
For the A-weighting curve Laplace transfer function, the complete FilterScript code is given below:
ClearH1;  // clear primary filter from cascade

Main() // main loop

a={1, 129.4};
b={1, 676.7};
c={1, 4636};
d={1, 76655};

aa=conv(a,a); // polynomial multiplication
dd=conv(d,d);

aab=conv(aa,b);
aabc=conv(aab,c);

Na=conv(aabc,dd);
Nb = {0 ,0 , 1 ,0 ,0 , 0, 0}; // define numerator coefficients
G = 7.397e+09; // define gain

Ha = analogtf(Nb, Na, G, "symbolic");
Hd = bilinear(Ha,0, "symbolic");

Num = getnum(Hd);
Den = getden(Hd);
Gain = getgain(Hd)/computegain(Hd,1e3);    // set gain to 0dB@1kHz
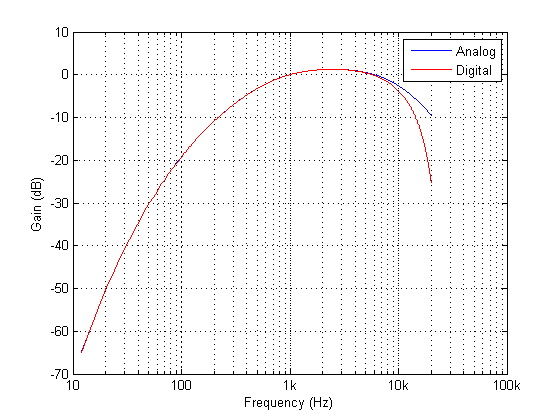
Frequency response of analog vs digital A-weighting filter for \(f_s=48kHz\). As seen, the digital equivalent magnitude response matches the ideal analog magnitude response very closely until \(6kHz\).
The ITU-R 486–4 weighting curve
Another weighting curve of interest is the ITU-R 486–4 weighting curve, developed by the BBC. Unlike the A-weighting filter, the ITU-R 468–4 curve describes subjective loudness for broadband stimuli. The main disadvantage of the A-weighting curve is that it underestimates the loudness judgement of real-world stimuli particularly in the frequency band from about 1–9 kHz.
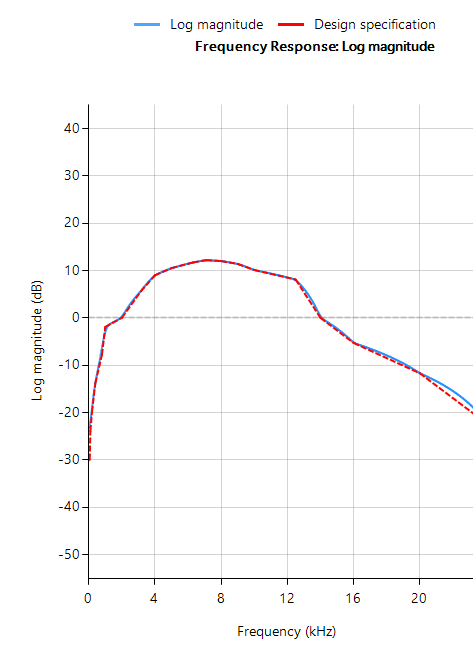
Due to the precise definition of the 486–4 weighting curve, there is no analog transfer function available. Instead the standard provides a table of amplitudes and frequencies – see here. This specification may be directly entered into FilterScript’s firarb() function for designing a suitable FIR filter, as shown below:
Frequency response of an ITU-R 468-4 FIR filter designed with FilterScript’s firarb() function for \(f_s=48kHz\)
As seen, FilterScript provides the designer with a very powerful symbolic scripting language for designing weighting curve filters. The following discussion now focuses on deployment of the A-weighting filter to an Arm based processor via the tool’s automatic code generator. The concepts and steps demonstrated below are equally valid for FIR filters.
Automatic code generation to Arm processor cores via CMSIS-DSP
The ASN Filter Designer’s automatic code generation engine facilitates the export of a designed filter to Cortex-M Arm based processors via the CMSIS-DSP software framework.
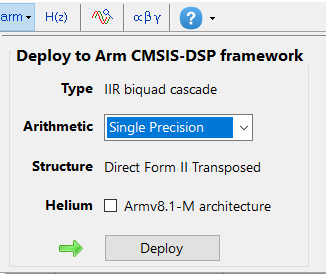
The tool’s built-in analytics and help functions assist the designer in successfully configuring the design for deployment. Professional licence users may expedite the deployment by using the Arm deployment wizard that automates the steps described below.
Steps required for Educational licenceusersonly
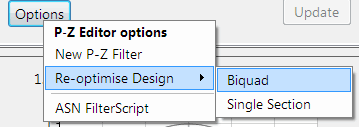
Before generating the code, the H2 filter (i.e. the filter designed in FilterScript) needs to be firstly re-optimised (transformed) to an H1 filter (main filter) structure for deployment. The options menu can be found under the P-Z tab in the main UI.
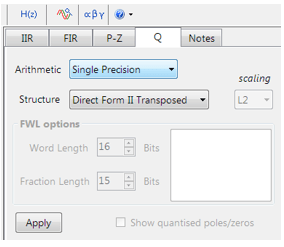
All floating point IIR filters designs must be based on Single Precision arithmetic and either a Direct Form I or Direct Form II Transposed filter structure. The Direct Form II Transposed structure is advocated for floating point implementation by virtue of its higher numerically accuracy.
Quantisation and filter structure settings can be found under the Q tab (as shown on the left). Setting Arithmetic to Single Precision and Structure to Direct Form II Transposed and clicking on the Apply button configures the IIR considered herein for the CMSIS-DSP software framework.
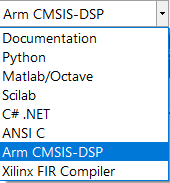
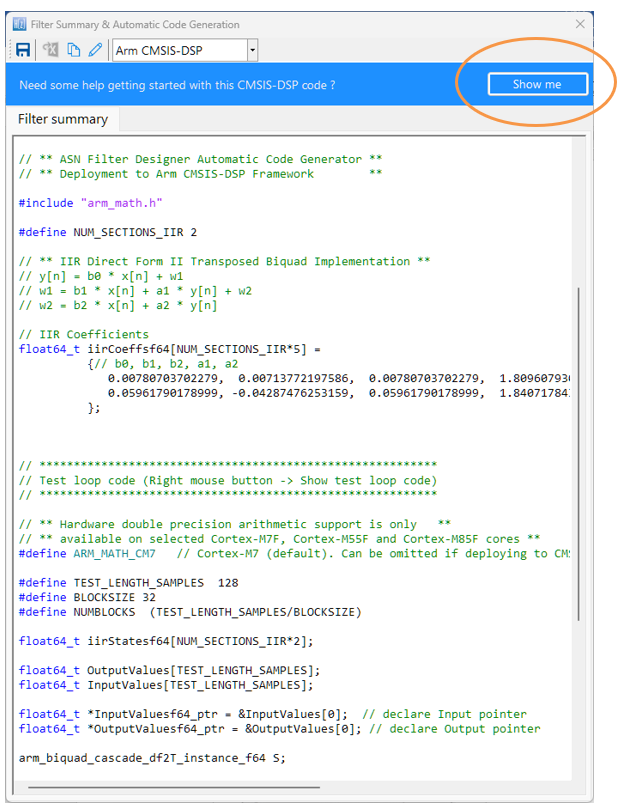
Select the Arm CMSIS-DSP framework from the selection box in the filter summary window:
The automatically generated C code based on the CMSIS-DSP framework for direct implementation on an Arm based Cortex-M processor is shown below:
As seen, the ASN Filter Designer’s automatic code generator generates all initialisation code, scaling and data structures needed to implement the A-weighting filter IIR filter via Arm’s CMSIS-DSP library. A detailed help tutorial is available by clicking on the Show me button.
Sanjeev is a RTEI (Real-Time Edge Intelligence) visionary and expert in signals and systems with a track record of successfully developing over 26 commercial products. He is a Distinguished Arm Ambassador and advises top international blue chip companies on their AIoT/RTEI solutions and strategies for I5.0, telemedicine, smart healthcare, smart grids and smart buildings.
https://www.advsolned.com/wp-content/uploads/2019/10/aweightingcurve.png420560Dr. Sanjeev Sarpalhttps://www.advsolned.com/wp-content/uploads/2021/07/asn_logo_red_met_tekst_helder-e1755353934770.pngDr. Sanjeev Sarpal2019-10-03 21:22:482025-06-19 17:00:33A-weighting equalisation: Designing and deploying to Arm Cortex-M microcontrollers
Energy companies have struggled for years with meeting demand with supply with society’s increasing demand for energy. This been made even more challenging with more people using electric vehicles and smart cities demanding more lighting.
Modern IoT sensors and smart grid solutions help energy companies and consumers improve and optimize the modern grid for the 21st century. But what does all the jargon really mean?
Blackout
The UK National Grid recently experienced a major outage that left almost a million homes in the dark and forced trains to a standstill. The source of the blackout was traced back to two generators that failed, resulting in grid’s frequency falling below the critical 49.5Hz set by the regulator.
According to the media the UK blackout was triggered when the frequency slumped to 48.88Hz, which is well below the legal limits set by the regulatory agencies.
But what do these limits really mean?
Some background information
The energy grid frequency is 50Hz in Europe, 60Hz in the US. Japan has an unusual historical situation in that the East of the country runs on a European 50Hz system and the West of country runs on an American 60Hz system.
In all cases, in order to meet the energy requirements, several generators are needed to work in parallel and must be synchronised. Accurate frequency control is required to control the amount of power delivered by multiple generators in order to provide a stable power supply to consumers. The challenge for the energy companies is meeting the changes in supply and demand, since higher demand than supply will result in fall of frequency and vice versa.
Thus, the challenge for IoT sensors and algorithms is measuring the operating frequency and phase to a sufficient accuracy and adjusting the generators to meet the energy demand requirement at that particular time. But how?
A PMU (phase measurement unit) is typically used the measure and report back (typically 30-60 measurements per second) to the network operator what the actual frequency and phase of various points on the grid are. In order to synchronise the measurements, the PMU internal clocks are time synchronised via a GPS (global positioning system) unit, such that all reported frequency and phase measured across the grid are time aligned.
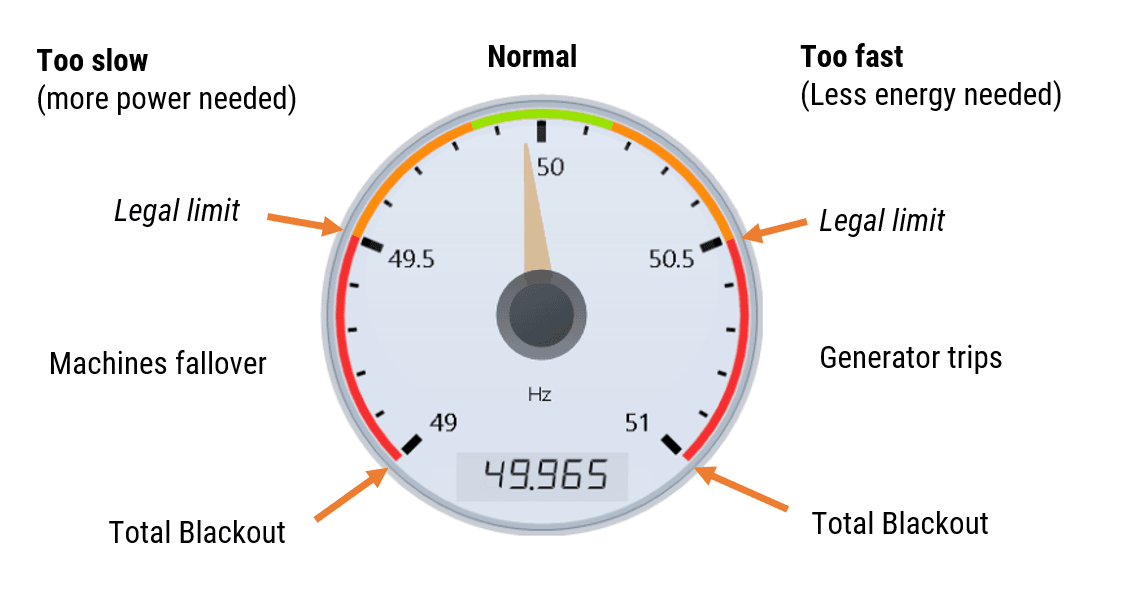
The frequency limits are shown below:
The challenge for energy managers
As seen above, the normal region in Europe is between 49.85 – 50.15Hz. If the generators exceed 50.15Hz (entering the orange region), there is too much energy and the generators need to be rolled back a little. If the frequency falls below 49.85Hz (also in the orange region), there is not enough energy to meet demand, and more energy is needed. In all cases, the frequency must never enter the red region, otherwise Blackouts will occur.
The energy company is legally obliged to keep the powerline frequency between 49.5 – 50.5Hz (± 1%). This is typically tracked to an accuracy of ± 1mHz resolution.
Blackouts
The UK blackout was triggered when the frequency slumped to 48.88Hz, which is well below the legal limits and in the blackout region. The damage to the UK economy has still yet to be determined, but National Grid UK should be considering adding extra redundancy safe guards in order restore public confidence.
Dips and swells tracking
Another common problem that occurs is that of energy dips, i.e. the voltage momentarily drops for a few cycles. Think about lights temporarily flickering in your house.
In factories running machinery, this usually occurs when a machine is started up, indicating imminent component failure. Swells are the opposite of dips, but are much less common.
ASN’s IoT sensor and algorithms play an essential role in keeping the grid healthy, as demonstrated in the video below.
5G’s claim of ultra-low latency, and suitability for real-time edge processing has created a fever of interest in the IoT market. But what does Real-time dataset analysis really mean for your IoT application?
It’s estimated that the global smart sensor market will have over 50 billion smart devices in 2020. All of these IoT smart sensors (temperature, pressure, gas, image, motion, loadcells) will be connected to Wifi, 5G, LoRa etc network services via embedded processors performing real-time signal processing on the captured datasets.
But there are a number of challenges….
IoT sensor measurement challenge
A common challenge is that many sensors used in these applications require a little bit of filtering in order to clean the measurement data in order to make it useful for analysis.
Let’s have a look at what sensor data really is…. All sensors produce measurement data. These measurement data contain two types of components:
Wanted components, i.e. information what we want to know
Unwanted components, measurement noise, 50/60Hz powerline interference, glitches etc – what we don’t want to know
Unwanted components degrade system performance and need to be removed.
So, how do we do it?
DSP means Digital Signal Processing and is a mathematical recipe (algorithm) that can be applied to IoT sensor measurement data in order to clean it and make it useful for analysis.
But that’s not all! DSP algorithms can also help in analysing data, producing more accurate results for decision making with ML (machine learning). They can also improve overall system performance with existing hardware (no need to redesign your hardware – a massive cost saving!), and can reduce the data sent off to the cloud by pre-analysing data and only sending what is necessary.
Do you have a practical example?
All analog sensor signals need to be sampled by a digital system in order to make them usable for analysis in the digital domain. The choice of the sampling frequency is primarily goverend by the maximum frequency that needs to be analysed. But what are design rules?
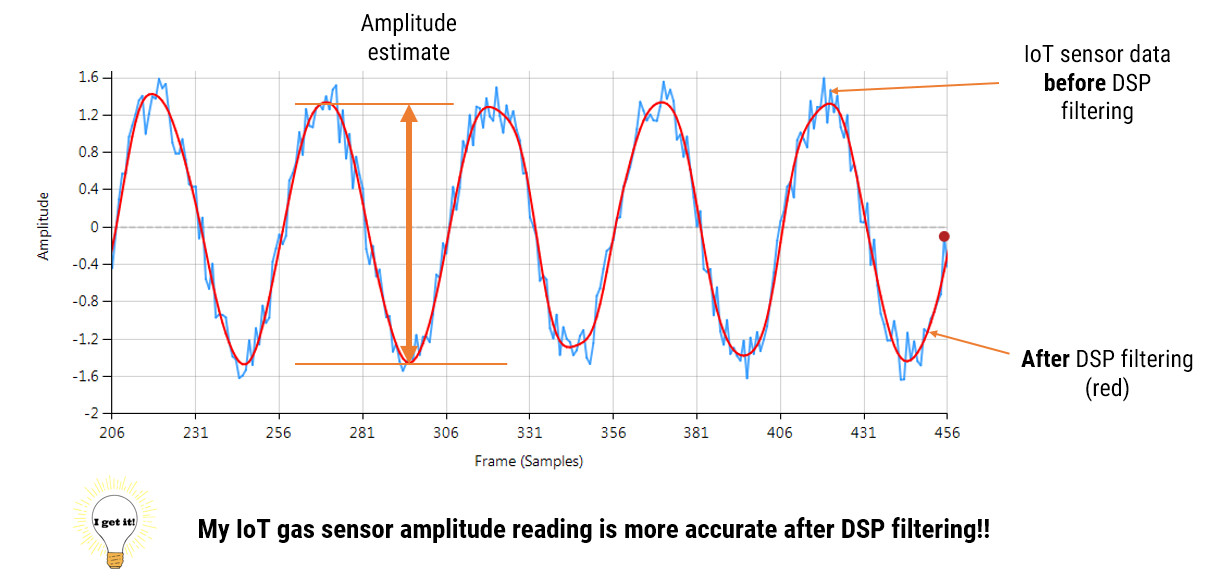
Consider the following application for gas sensor measurement (see the figure below). The requirement is to determine the amplitude of the noisy sinusoid (shown in blue) in order to get an estimate of gas concentration, where the bigger amplitude, the more the gas concentration.
In order to clean the noisy sinusoid with a filtering algorithm (results shown in red), we first need to find what the frequency of the sinusoid is. The Nyquist sampling Theorem is used for determining this value, and states that,
the analog signal must be sampled at a least two times the maximum analog frequency component.
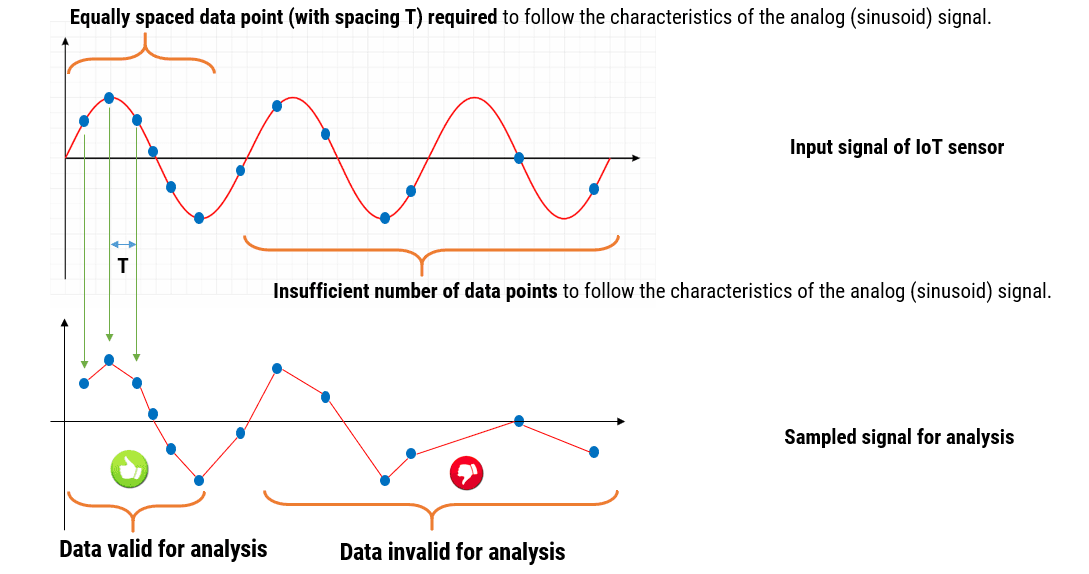
For our gas sensor, the frequency of the blue sinusoid is about 5Hz, so a minimum sampling frequency of 10Hz is required in order to perform valid analysis on the sampled dataset. However, many designers choose a value 10 times higher than Nyquist in order account for the effects of the noise component and not to be on the borderline of the Nyquist-sampling theorem.
The concept of sampling is demonstrated below:
What does Real-time really mean?
Many clients ask us to clarify what real-time really means.
Most people assume that an instant response to a button push or event means real-time. However, the reality is a little more complicated, as a real-time system means that the response is deterministic occurring within a known time frame. This could be seconds or even micro-seconds. In all cases, the response or action time is always known.
For the gas sensor discussed above, the sampling frequency must be constant in order to correctly follow the characteristics of the sinusoid. If the sampling rate varied over time, the sampled data wouldn’t match the design criteria of the algorithmic filtering blocks, and the data analysiswould be invalid.
In recent years, much has been said about 5G’s potentially ultra-low latency, and suitability for real-time edge processing. Time will tell how far 5G’s low latency claim can be realised. However, latency in network/cloud services, means that no communication channel can be guaranteed to be real-time 100% of the time. This is further complicated by the requirement of meeting the Nyquist-sampling criteria for sampling analog sensors signals.
In light of all of these issues, our experience has shown that real-time sensor processing (especially for critical automotive or industrial control operations) should be performed at the edge on an embedded real-time processor for maximum reliability and safety.
Our close collaboration with leading technology companies, such as: Arm, Texas Instruments and KPN ensure that our 5G IoT solutions are built with the latest design paradigms using the best of today’s sensor and networking technology.
https://www.advsolned.com/wp-content/uploads/2019/08/5g.jpg594810ASN consultancy teamhttps://www.advsolned.com/wp-content/uploads/2021/07/asn_logo_red_met_tekst_helder-e1755353934770.pngASN consultancy team2019-08-04 20:04:242019-08-04 20:15:29IoT Real-time dataset analysis with 5G: the big challenges
In ECG signal processing, the Removal of 50/60Hz powerline interference from delicate information rich ECG biomedical waveforms is a challenging task! The challenge is further complicated by adjusting for the effects of EMG, such as a patient limb/torso movement or even breathing. A traditional approach adopted by many is to use a 2nd order IIR notch filter:
where, \(w_o=\frac{2\pi f_o}{fs}\) controls the centre frequency, \(f_o\) of the notch, and \(r=1-\frac{\pi BW}{fs}\) controls the bandwidth (-3dB point) of the notch.
What’s the challenge?
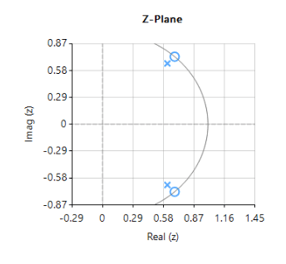
As seen above, \(H(z) \) is simple to implement, but the difficulty lies in finding an optimal value of \(r\), as a desirable sharp notch means that the poles are close to unit circle (see right).
In the presence of stationary interference, e.g. the patient is absolutely still and effects of breathing on the sensor data are minimal this may not be a problem.
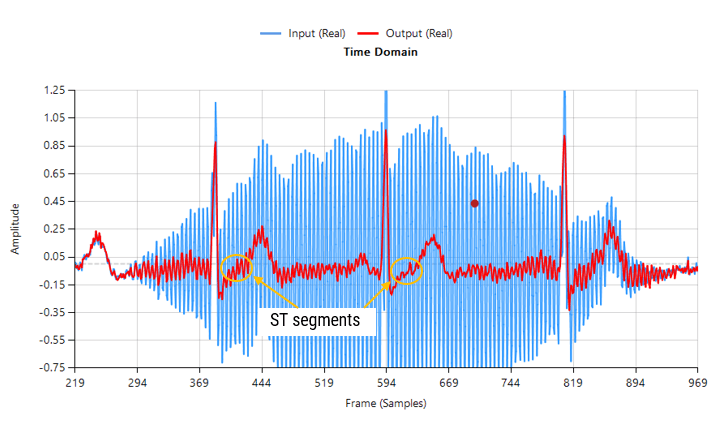
However, when considering the effects of EMG on the captured waveform (a much more realistic situation), the IIR filter’s feedback (poles) causes ringing on the filtered waveform, as illustrated below:
Contaminated ECG with non-stationary 50Hz powerline interference (IIR filtering)
As seen above, although a majority of the 50Hz powerline interference has been removed, there is still significant ringing around the main peaks (filtered output shown in red). This ringing is undesirable for many biomedical applications, as vital cardiac information such as the ST segment cannot be clearly analysed.
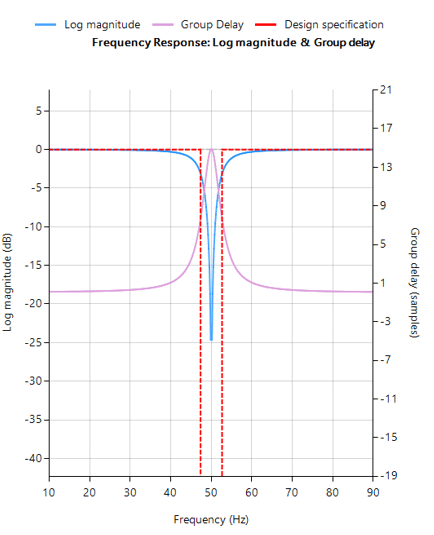
The frequency reponse of the IIR used to filter the above ECG data is shown below.
IIR notch filter frequency response
Analysing the plot it can be seen that the filter’s group delay (or average delay) is non-linear but almost zero in the passbands, which means no distortion. The group delay at 50Hz rises to 15 samples, which is the source of the ringing – where the closer to poles are to unit circle the greater the group delay.
ASN FilterScript offers designers the notch() function, which is a direct implemention of H(z), as shown below:
ClearH1;  // clear primary filter from cascade
ShowH2DM;   // show DM on chart

interface BW={0.1,10,.1,1};

Main()

F=50;
Hd=notch(F,BW,"symbolic");
Num = getnum(Hd); // define numerator coefficients
Den = getden(Hd); // define denominator coefficients
Gain = getgain(Hd); // define gain
Savitzky-Golay FIR filters
A solution to the aforementioned mentioned ringing as well as noise reduction can be achieved by virtue of a Savitzky-Golay lowpass smoothing filter. These filters are FIR filters, and thus have no feedback coefficients and no ringing!
Savitzky-Golay (polynomial) smoothing filters or least-squares smoothing filters are generalizations of the FIR average filter that can better preserve the high-frequency content of the desired signal, at the expense of not removing as much noise as an FIR average. The particular formulation of Savitzky-Golay filters preserves various moment orders better than other smoothing methods, which tend to preserve peak widths and heights better than Savitzky-Golay. As such, Savitzky-Golay filters are very suitable for biomedical data, such as ECG datasets.
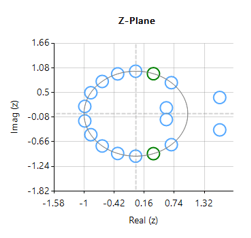
Eliminating the 50Hz powerline component
Designing an 18th order Savitzky-Golay filter with a 4th order polynomial fit (see the example code below), we obtain an FIR filter with a zero distribution as shown on the right. However, as we wish to eliminate the 50Hz component completely, the tool’s P-Z editor can be used to nudge a zero pair (shown in green) to exactly 50Hz.
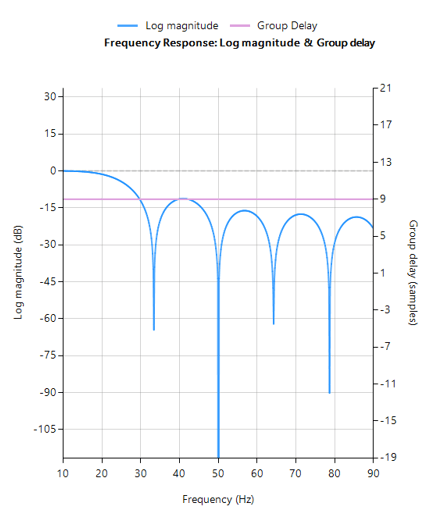
The resulting frequency response is shown below, where it can be seen that there is notch at exactly 50Hz, and the group delay of 9 samples (shown in purple) is constant across the frequency band.
FIR Savitzky-Golay filter frequency response
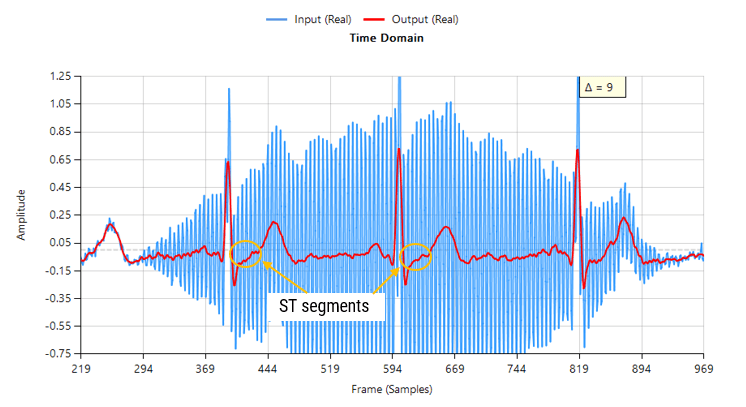
Passing the tainted ECG dataset through our tweaked Savitzky-Golay filter, and adjusting for the group delay we obtain:
Contaminated ECG with non-stationary 50Hz powerline interference (FIR filtering)
As seen, there are no signs of ringing and the ST segments are now clearly visible for analysis. Notice also how the filter (shown in red) has reduced the measurement noise, emphasising the practicality of Savitzky-Golay filter’s for biomedical signal processing.
A Savitzky-Golay may be designed and optimised in ASN FilterScript via the savgolay() function, as follows:
ClearH1;  // clear primary filter from cascade

interface L = {2, 50,2,24};
interface P = {2, 10,1,4};

Main()

Hd=savgolay(L,P,"numeric");  // Design Savitzky-Golay lowpass
Num=getnum(Hd);
Den={1};
Gain=getgain(Hd);
Deployment
This filter may now be deployed to variety of domains via the tool’s automatic code generator, enabling rapid deployment in Matlab, Python and embedded Arm Cortex-M devices.
Sanjeev is a RTEI (Real-Time Edge Intelligence) visionary and expert in signals and systems with a track record of successfully developing over 26 commercial products. He is a Distinguished Arm Ambassador and advises top international blue chip companies on their AIoT/RTEI solutions and strategies for I5.0, telemedicine, smart healthcare, smart grids and smart buildings.
When considering an asset track and trace IoT application in a factory or warehouse, many think of the well-established Barcode or QR code. Although this technology is firmly embedded into modern society as a reliable, low cost and easy to understand pillar for tracking and tracing assets, many companies were quick to adopt the technology as an easy way of minimising human errors and increasing process efficiency.
However, when managing the location of thousands of assets, this simple system is somewhat limited in the overview that it can provide an ERP (enterprise requirements system) system. A significant aspect of Industry 4.0 is process transparency, providing the ERP and BI (business intelligence) systems with the most update-to-date information, allowing management to identify bottlenecks and potential areas of weakness.
Until several years ago, asset tracking was strengthened by combining RFID tags with GPS (global positioning system) technology. Although this was certainly a step in the right direction, the implementation costs were high and technology suffered from RF interference, short range and moderate location accuracy. GPS also had the big disadvantage of only being able to work outdoors and has a location accuracy of several metres – not really suitable!
Industry 4.0 real time location systems (RTLS)
Over the years, different technology has appeared as solution to providing real-time assets location information to the ERP system. As mentioned above, technologies, such as RFIDs, bar codes and GPS have certainly been a step in the right direction, but didn’t fully meet the requirements of modern businesses look to optimise their processes.
Ultrawide band (UWB) radar
With advances in radar technology over the last few years, a few silicon vendors are now producing affordable UWB radar devices suitable for trace and trace applications. Radar technology that used to cost thousands of Euros, and was primarily aimed a military technology, is now available for tens of Euros, making it viable candidate for track and trace applications.
UWB highlights
Ten times more accurate than GPS, Wi-Fi or Bluetooth with typical accuracies a good as 10cm.
Hundreds of metres range with data communication options.
Very low power and safe for humans – power emission typically a fraction of percent of a typical Wi-Fi router.
Licence free ISM band, meaning no complicated ETSI/FCC certification and lower implementation costs.
Penetrates walls and doors, making it ideal for warehouses and buildings.
Contemporary UWB based solutions finally allow for a true RTLS implementation, giving enterprises control over their personnel and assets. Whether tracking containers through a supply chain, optimising manufacturing processes, or providing asset traceability, an RTLS-UWB system provides an ERP system with real-time situation awareness that can be acted upon instantly.
Benefits for your enterprise
Inventory accuracy: achieve 99.9% inventory accuracy without the need for meticulous manual audits that can take hours or even days. An RTLS-UWB system provides you with all of your asset location information in real-time.
Live situation update: feed the ERP and BI systems with an accurate real-time picture of asset location and personnel trends.
Personnel safety: attaching tags to your employees helps track process efficiency and may also be used to alert personnel about entering dangerous areas. The tag locations are also invaluable in case of an emergency, such as fire, as the location of all personnel is known at all times.
e-paper and sensors: modern tags use e-paper technology to only display the most up-to-date information (e.g. QR code, sensor readings). Extra sensor information, such as temperature, humidity and vibration provide a simple way of establishing anti-tampering and asset health.
Advanced Solutions Nederland (ASN) BV is an international market leader in innovative IoT smart sensor and track and trace RTLS-UWB technological solutions.
Where ‘smart traffic’ has already 417 billion hits on google, I only found ‘smart air’ for a kind of door lock and ‘smart drone’ for an advanced toy drone. But definitely, drones are so hot that they will become part of something called ‘smart air’. The SESAR project predicts that drones will make 250 billion hours of flight in the European Union alone. For comparison: this is far more than the air traffic of ‘normal’ airplanes today.
Because drones are using many sensors, we did some research how the use of drones can grow to maturity and fuel ‘smart air’. Today we talk about challenges for delivery drones.
Delivery drones
No wonder, drones have proven to be very convenient already and have even more promises in store. Soon, it will be commonplace that drones are delivering packages, from hot pizzas to even more urgent medicines. And even humans: the first drone taxis are already being tested. At this moment, drones are already used for drag-and-drop deliveries in some rural and faraway areas. Most articles on the internet talk about the use in drones in big city areas. And there they have the big advantage of an -still- almost empty sky instead of congested roads and overfull parking places. For that, delivery by drones will be faster and more predictable.
But until use of drones are entirely tried and tested, most drone developments will take place on rural environments. Because here the risk of large damage is a lot smaller when something will go wrong. In time, delivery drones will still be used in rural places. Maybe as a standalone, maybe in combination with self-driving trucks. Reach will not be a big problem, since the whole word is getting connected fast. So, reach will almost only depend on battery endurance. And for now, these batteries have only a limited capacity for distance and cargo.
Challenges while travelling
Like all delivery services, drone delivery has to a pick-up a package, travel to the destination and drop-of the package. While travelling, drones have to know how to reach their destination. Meanwhile, there are some challenges:
Risk of colliding, with other drones, birds and other air users. Just like other traffic
And at point in time, some traffic rules have to be set in place. Sensors can help to let the drone follow these rules
How drones can stay on course, even with wind
Preventing drones to cross over forbidden (known) areas and unexpected ‘wrong’ areas (e.g. a building or a wood on fire)
How to prevent a package from falling? How to alert that a package will probably fall? Or maybe the drone itself? If so, measurement can be taken. Already, there are experiments with self-destruction. But maybe more practical solutions can be found to let the drone aim for a ‘safe area’, such as a park, river, etc. for an ‘emergency landing’
Acceptance of drones beside safety: how to guarentee privacy when drones are flying over peopled areas? Then there is the issue of noise: research shows that people find the noise of drones one of the most annoying forms of noise
Challenges with dropping the cargo
For now, the drop-of is literally done by dropping-of the cargo. Maybe with the aid of a cord which places the package as soft as possible to the ground. But anyhow: the drone stays in the air. So, technology has to get safe: for the package to be delivered undamaged. How does the drone know that the right person gets the package? And we have to prevent dogs from biting the package. And of course, to prevent that the dropped cargo will harm humans, animals or buildings or even worse.
The use of sensors
The application possibilities of drones are very promising for delivery uses. It is still in its experimental phase. But with developments going fast, soon it will reach the maturity phase. For this, there are two-fold kind of challenges.
Some are challenges on privacy, safety and security. These challenges have to be solved before the use of drones will get widespread trust and acceptance. The other are technical and communication issues: where multiple drones are being used – especially in cities- challenges how drones can and have to behave in traffic has to be solved.
In both challenges, sensors play a pivotal role in solving the technical questions. In all cases, ASN Filter Designer can help with sensor measurement with real-time feedback and the powerful signal analyzer. How? Look at ASN Filter Designer or mail ASN consultancy: designs@advsolned.com
Do you agree with this list? Do you have other suggestions? Please let us know!
Typical challenges faced by assets managers include:
How to measure mechanical component fatigue?
How to assess electrical wiring health?
How to reduce overall operating costs, but not comprise on public safety?
Risks posed by hackers & terrorists
Asset damage due to vandalism
Preventative Maintenance aims to solve the aforementioned problems by acting pre-emptively. This is achieved by constantly monitoring the performance of critical components (usually with sensors) and then alerting the maintenance team that a component is about to fail. The asset management team can then schedule maintenance in order to replace the failing component(s) with minimum disruption to the public, and overall lower operational costs.
Plan maintenance
Machine health care
Motor health care
Secure firmware updates and anti-tampering
Plan maintenance
Monitoring the health of critical component, such as a lamp, motor or machine component and input power supply. Our algorithms and analytics help asset management departments provide planned maintenance.
A better maintenance program is achieved by constantly monitoring the performance of critical components (usually with sensors or other devices) and then alerting the maintenance team that a component is about to fail.
Machine health care
The health of a machine can be determined by ‘listening’ to the sound it makes via microphones. Algorithms filter and compare recorded audio to fingerprint templates of known failures.
Motor health care
The health of an industrial motor be determined by analysis the phase currents. Algorithms filter and compare captured data to fingerprints templates of known failures. The phase current data can also be used to check for wire breaks or phase failure.
Secure firmware updates & Anti-tampering
ASN’s security module provides asset protection up to military grade, and while at the same time allowing for secure (encrypted) firmware updates.
ASN contactless measurement, smart algorithms and alerting offers the ideal condition for this programme. The asset management team can then schedule maintenance in order to replace the failing component(s) with minimum disruption to the public, and overall lower operational costs.
Let’s make an appointment to see how can help you create an effective maintenance programme and reduce your Total Cost of Ownership.
Industrial induction motors are found everywhere: Lifts, escalators, cable cars, water sluices, cranes, and even washing machines etc. Motors form the backbone of these devices. Since they are mission critical, a failure of a motor may disrupt the whole production line, crippling your precious infrastructure as a whole. As an example: if the motor fails on a water sluice, the disruption means that ships can’t deliver their cargo on time. Our experience has shown that with preventative motor maintenance, you can save up to 51% of your maintenance budget!
Common sources of industrial motor failure
Of course, each industrial motor has its own characteristics. However, common sources of failure in an industrial induction motor are:
Ball bearing and rotor crack/break
Stator winding faults
Rotor winding faults (rotor bars, end-rings etc.)
Save up to 51% with preventative maintenance
For public infrastructure, industrial motors are mission critical. They need to be regularly be checked under expensive maintenance programmes. With ASN’s IoT solutions, you can predict and prevent equipment failure by monitoring product wear and replacement rates. And if you recognize a slight disturbance, you can solve them easily. Before little faults have become big and expensive problems. When little faults are recognized, they can be repaired without any signifcant downtime. At a time it suits your client best. As such, you can improve the reliability of your assets and reduce downtime.
Effective and efficient use of an engineer’s precious time
Motor health care starts with sensors. With these sensors, you can monitor the running of your monitors automatically by placing sensors in the vicinity of your motors. When a signal pops up that there might be a problem, an engineer can repair this motor. Previously, engineers did their inspection rounds, giving every motor the same attention. Now, engineers can focus on motors that really need attention.
With preventative maintenance, your customers can save a fortune and minimise any disruption to service. You can save up to 51% on your maintenance costs with our Preventative Maintenance solutions. They are based on safe contactless sensor measurement, and optimize the life expectancy of your industrial motor. Learn more at: https://www.advsolned.com/motor-health-care/ or drop us a line at: info@advsolned.com
https://www.advsolned.com/wp-content/uploads/2018/08/motor_1130_752.jpg7521130ASN consultancy teamhttps://www.advsolned.com/wp-content/uploads/2021/07/asn_logo_red_met_tekst_helder-e1755353934770.pngASN consultancy team2018-08-16 12:23:032018-08-28 17:31:48Preventative motor maintenance: save up to 51% of your maintenance budget!