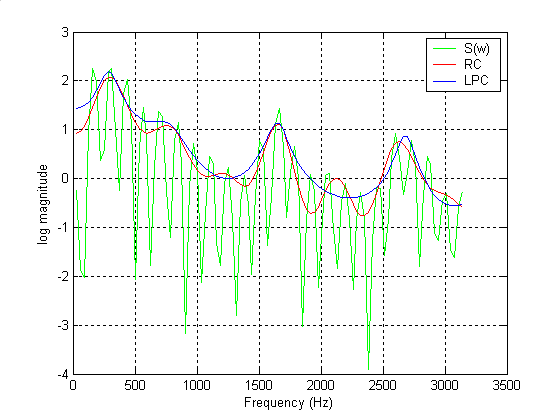
According to the basic model for speech synthesis, speech is composed of an excitation sequence linearly convolved with the impulse response of the vocal tract transfer function. The process of Cepstral deconvolution attempts to deconvolve the excitation from the vocal tract transfer function without making any of the assumptions that were necessary for linear prediction. Thus, it should be possible to obtain a transfer function that shows the effects of both poles and zeros, since the deconvolution process makes no assumption about the statistics of the excitation. Therefore, we may view the Cepstrum as an alternative method of system modelling.
The Real Cepstrum
Consider a frame of speech data, s(n) that is comprised of a vocal tract transfer function, p(n) convolved with an excitation, e(n).
![]()
The real cepstrum, c(n) may be calculated by determining the logarithm of the magnitude of the Fourier Transform of s(n), and then obtaining the inverse Fourier Transform of the resulting sequence, as shown below:

A natural or base 10 logarithm is typically used for most applications but in principle any base may be used. The logarithm is a significant component to the whole operation, since we now have a linear combination in the frequency domain! See below.

Thus, the vocal tract spectrum, P(w) and excitation spectrum, E(w) are now additive (i.e. a linear combination). Researchers believed that by analysing these two signals as ‘time signals’, the excitation would manifest itself at large values of ‘frequency’ (high frequency ripple), whereas, the vocal tract spectral envelope would appear a low frequency ripple. Hence, the effects of the vocal tract and excitation may be separated. Since the original Cepstral formulation computed the spectrum of the log spectrum, the units of the frequency ripple were actually in time. Therefore, the word quefrency (anagram of frequency) was assigned to describe the ‘frequency’ of the ripples in this new pseudo time domain.
The spectral envelope pertaining to the vocal tract may be obtained by firstly multiplying c(n) by a rectangular window (lifter) of unit height and of a length long enough to contain all the low frequency information pertaining to just the vocal tract. The exact length of the lifter is actually depend upon on the amount of detail required for the application, and as a consequence is chosen empirically.
Analyzing the above, notice that both linear prediction (blue) and the cepstrum (red) model the original spectrum (green) reasonably well. However, upon closer examination, notice that the Cepstral spectral envelope has produced some detail in the minima (between the peaks around the 2KHz region), which the linear prediction spectral envelope has failed to do. This is as expected, because in Cepstral deconvolution, no assumptions have been made concerning an all-pole model. Therefore, the processed frame of voiced speech contains a mixture of both poles and zeros, which can be better represented with the Cepstrum rather than the industry standard linear prediction technique.

