Advances in telemedicine healthcare products over the past decades have been truly miraculous with ingenious little devices invented by start-ups as well as by larger corporations, .e.g Apple’s smart watch and the Fitbit. These advancements have been facilitated by the availability of low-cost microcontrollers offering algorithmic functionality, allowing developers to implement wearables with excellent battery life and edge based real-time data analysis.
Over 90% of the microcontrollers used in the smart product market are powered by so called Arm Cortex-M processors that offer a combination of high algorithmic performance, low-power and security. The Arm Cortex-M4 is a very popular choice with hundreds of silicon vendors (including ST, TI, NXP, ADI, Nordic, Microchip, Renesas), as it offers DSP (digital signal processing) functionality traditionally found in more expensive devices and is low-power. Arm and its rich eco system of partners provide developers with easy-to-use tooling and tried and tested software libraries, such as the CMSIS-DSP and CMSIS-NN frameworks for algorithm development and machine learning.
The choice is vast, and can be very confusing. Therefore, here are some practical hints and tips for both managers and developers to help you decide which Arm Cortex-M processor is best for your biomedical product.
Which Arm Cortex-M processor do I choose for my biomedical application?
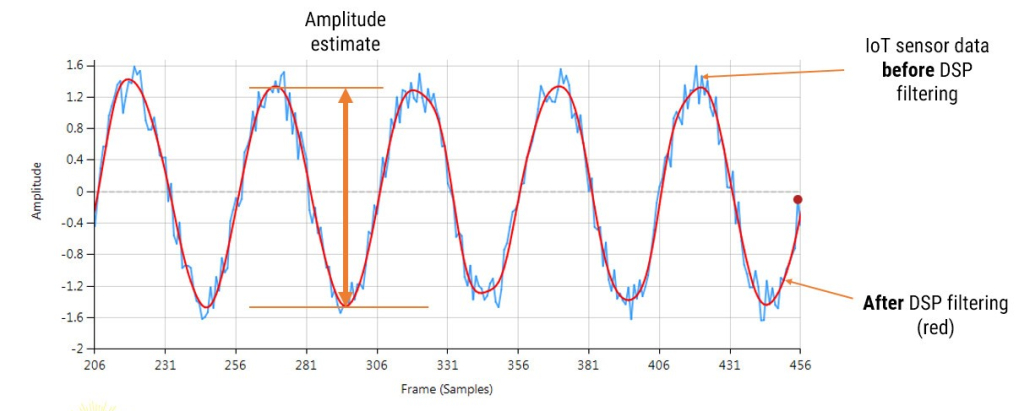
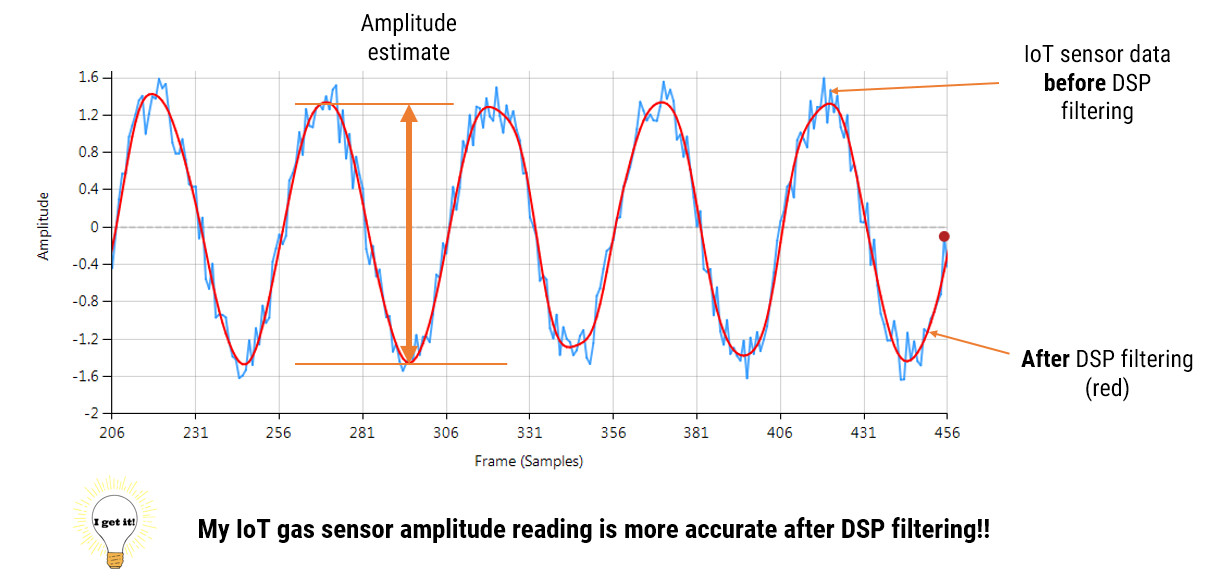
The Arm Cortex-M0+ processor is an ultra-low power 32-bit processor designed for very low-cost IoT applications, such as simple wearable devices. The low price point is comparable with equivalent 8-bit devices, but with 32-bit performance. Microcontrollers built around the M0+ processor provide developers with excellent battery life (months to years), a rich peripheral set and a basic amount of connectivity and computational performance. The latter means that only simple algorithms can be implemented, such as algorithms for correcting baseline wander and minimizing the effects of motion artefacts using accelerometer data via an adaptive filter, such as the NLMS algorithm. Although for PPG pulse rate measurement applications, the sampling rate is typically 50Hz, leaving the processor plenty of time to perform various simpler algorithmic operations, such as digital filtering and zero-crossing detection.
For high performance PPG applications, sampling rates in the order of 500Hz are typically used. These types of applications usually look at more biomedical features, such as identifying the Systolic and Diastolic phases and finding the Dicrotic notch using feature extraction algorithms and ML models. These extra functionalities provide a significant strain on the processor’s abilities, and as such are beyond the abilities of the M0+.
The Cortex-M3 is a step up from the M0+, offering better computational performance but with less power efficiency. The extra processing power, rich hardware peripheral set for connecting other sensors and connectivity options makes the M3 a very good choice for developers looking to develop slightly more advanced wearable products, such as the Fitbit device that is based on ST’s low-power STM32L series of microcontrollers.
High performance wearables and beyond
The Arm Cortex-M4 processor and its more powerful bigger brother the Cortex-M7 are highly-efficient embedded processors designed for IoT applications that require decent real-time signal processing performance and memory. Depending on the flavour of the processor, the M4F/M7F processors implement DSP hardware accelerated instructions, as well hardware floating point support. This lends itself to the efficient implementation of much more computationally intensive biomedical DSP and ML algorithms needed for more advanced telemedicine products.
The hardware floating point support unit expedites RAD (rapid application development), as algorithms and functions developed in Matlab or Python can be ported to C for implementation without the need for a lengthy data arithmetic quantisation analysis. Microcontrollers based on the M4F or M7F, usually offer many of the hardware peripheral and connectivity advantages of the M3, providing developers with a very powerful, low power development platform for their telemedicine application.
The Arm Cortex-M33 is a step up from the M4 focusing on algorithms and hardware security via Arm’s TrustZone technology and memory-protection units. The Cortex-M33 processor attempts to achieve an optimal blend between real-time algorithmic performance, energy efficiency and system security.
State-of-the art AI microcontrollers
Released in 2020, the Arm Cortex-M55 processor and its bigger brother the Cortex-M85 are targeted for AI applications on microcontrollers. These processors feature Arm’s Helium vector processing technology, bringing energy-efficient digital signal processing (DSP) and machine learning (ML) capabilities to the Cortex-M family. In November 2023, Arm announced the release of Cortex-M52 processor for IoT applications. This processor looks to replace the older M33 processor, as it combines Helium technology with Arm TrustZone technology.
Although the IP for these processors is available for licencing, only a few IC vendors have developed a microcontroller, e.g. Samsung’s Exynos W920 SoC that has been specifically designed for the wearables market. The SoC packs two Arm Cortex-A55 processors, and the Arm Mali-G68 GPU using state-of-the art 5nm semiconductor technology. The chipset also features a dedicated low-power Cortex-M55 display processor for handling AoD (Always-on Display) tasks – although a little over the top for simple wearable devices, the Exynos processor family certainly seems like an excellent choice for building next generation AI capable low-power wearable products.
So, which one do I choose?
The compromise for biomedical product developers when choosing an M4, M7 or M33 based microcontroller over an M3 device usually comes down to a trade-off between algorithmic performance, security requirements and battery life. If good battery life and simple algorithms are key, then M3 devices are a good choice. However, if more computationally intensive analysis algorithms are required (such as ML models), then the M4 or M7 should be used.
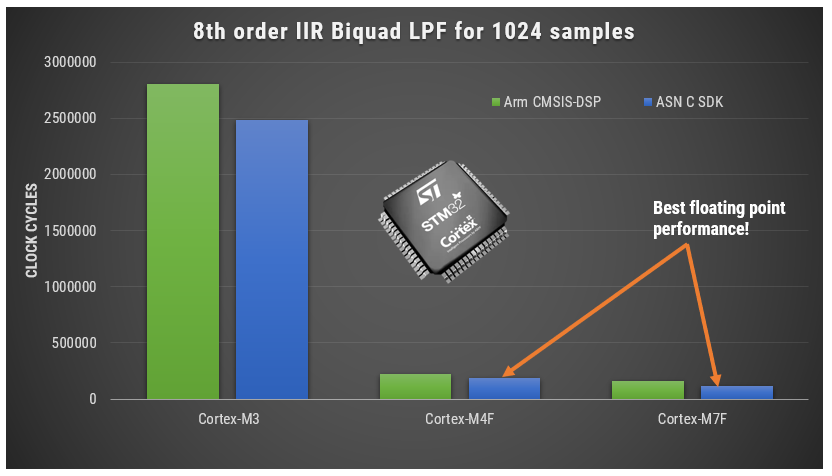
As mentioned earlier, the Armv7E-M architecture used in M4/M7 processors supports a DSP extension that implements an SIMD (single instruction, multiple data) architecture extension that can significantly improve the performance of an algorithm. The hardware floating point unit is very good for expediting MAC (multiply and accumulate) operations used in digital filtering, requiring just three cycles to complete. Other DSP operations such as add, subtract, multiply and divide require just one cycle to complete.
The M7 out performs its M4 little brother by offering approximately twice the computational performance and some devices even offer hardware double precision floating point support which make M4/M7 processors attractive for high accuracy algorithms needed for medical analysis.
If data security is paramount, for example protecting and securing transferring patient data to a cloud service, then the M33 or the M52 (when avalaible) are good choices. These devices also offer a high level of protection against tampering and running of authorised code via TrustZone’s trusted execution environment.
Some IC vendors now offer hybrid micro-controllers that implement multi-processors on chip, such as ST’s ST32Wx family that combine the M0+ and M4 in order to get the advantages of each processor and maximise battery life.
Finally, advances in semiconductor technology means that a modern M4F processor produced with 40nm process technology may match or even surpass the energy efficiency of an M3 produced with 90nm technology from several years ago. As such, higher performance processors that were until several years too costly and energy inefficient for low-cost wearables products are rapidly becoming a viable solution to this exciting marketplace.