|
|
|
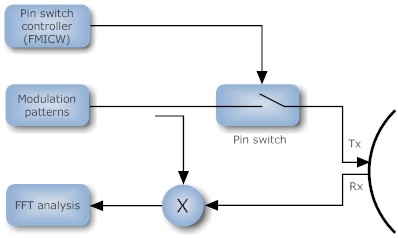
Example: Radar Signal Processing (The FMCW & FMICW Radar Model) FMCW (frequency modulated continuous wave) and FMICW (frequency modulated interrupted wave) radars have received a great deal of popularity by the military and automotive industries by virtue of their simplicity, high reliability and low cost. A simplified model of an FMCW / FMICW system is shown below in Figure 1.
Figure 1 - A simplified model of an FMCW/ FMICW radar system. Analyzing Figure 1, it can be seen that when operating the radar in FMCW mode (i.e., the PIN switch is permanently closed) the transmitted modulation waveforms are mixed with delayed replicas (multiple targets) via the mixer, and then analysed by an FFT algorithm. However, when FMICW is used, the transmit path (Tx) is interrupted by the PIN switch switching on and off. Notice that in this case, the mixer still uses the ‘unswitched’ transmit waveform in order to obtain the beat frequency waveform. FMICW systems have the advantage of relaxing the isolation requirements between transmitter and receiver, but have the disadvantage of limited range due to the switching constraints.
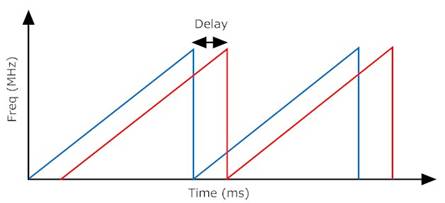
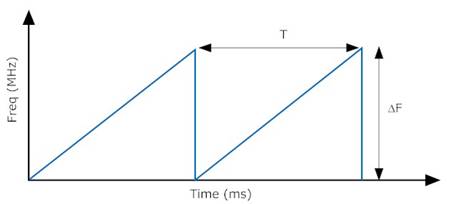
Figure 2 - FMCW radar concept. A plot of modulation patterns vs. time for a radar system receiving a modulation pattern from a target is shown above in Figure 2. Analyzing Figure 2, it can be seen that the received waveform (red) is simply a delayed replica of the transmitted waveform (blue). Also notice that the received modulation pattern could very well be an unwanted interfering radar signature, as well as a signature from a legitimate target - the radar system has no way of knowing! Notice that each sawtooth modulation waveform is categorised by a sweep time (T) and a sweep frequency (
Simply estimating the delay between transmitted and received waveforms leads to an estimate of range and beat frequency (fb). After implementing the model and equations in Matlab®, a simulation can be performed on the time domain signals. Thus, the time domain beat
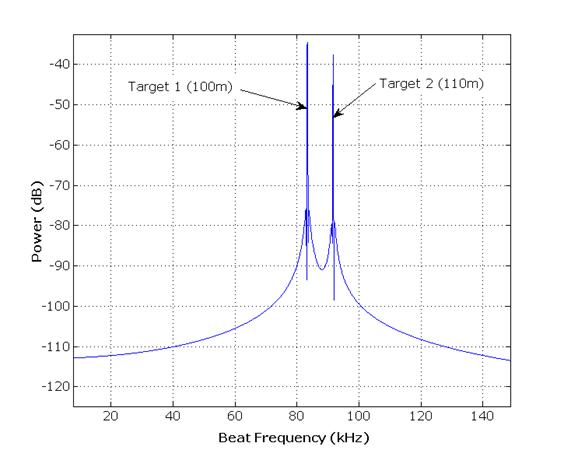
frequency signal can easily be transformed into the frequency domain (via an FFT) for analysis, as shown below in Figure 4. Analyzing figure 4, it can be seen
that for a two target scenario (
Figure 4 - FFT magnitude plot of beat frequencies.
|
||||
| Home | DSP Algorithms | Hardware Design | Radar Solutions | Disclaimer | Contact us |
|
|
|
| Copyright © Advanced Solutions Nederland BV, 2006-2017. All Rights Reserved. | |||